


E&E News’ Grace Yarrow reported that, “Bayer is withdrawing its request that the Trump administration impose countervailing duties on glyphosate imports from China after backlash from the agriculture industry.” “The…
Kansas City Fed: Farm Finances Positive, But Risks “More Notable,” While Crop Outlook for Canada, Australia Improves
In an update last week from the Federal Reserve Bank of Kansas City, “Ag Credit Conditions Remain Strong as Risks Grow,” Nathan Kauffman and Ty Kreitman stated that, “Agricultural credit conditions remained strong in the second quarter, but slower improvement was expected in the coming months. Farm income increased further according to respondents of the Federal Reserve Surveys of Agricultural Credit Conditions, but the pace of increase slowed from recent quarters and further softening was expected going forward.

“Farm loan repayment rates continued to strengthen, but the pace of improvement also slowed.
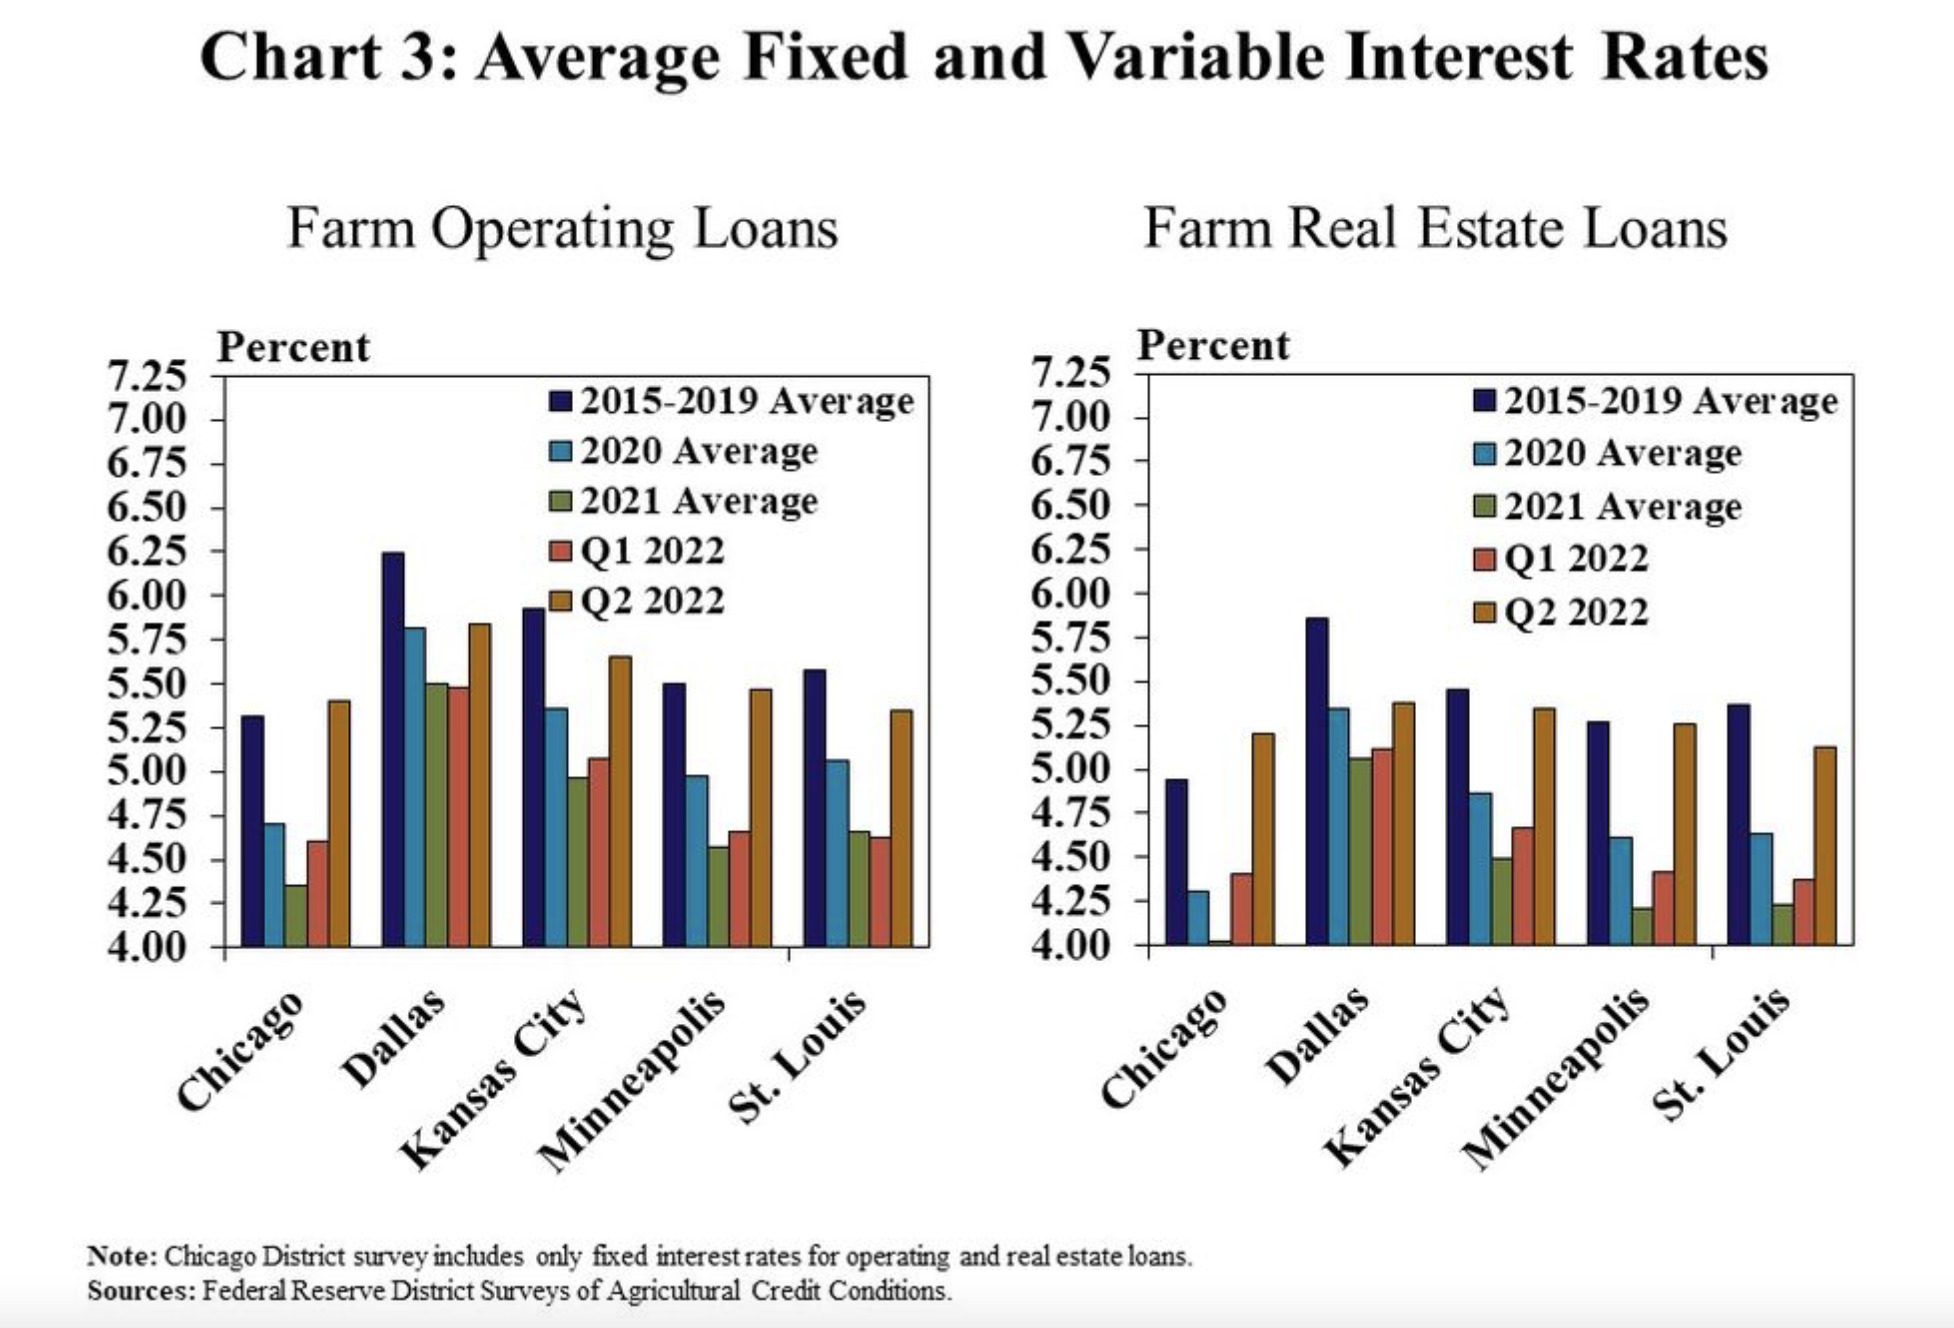
“Following nearly two years of acceleration, farmland values also showed signs of moderating as interest rates increased more notably.”

Kauffman and Kreitman added:
Strength in farm finances continued to support a positive outlook for agricultural credit conditions through the remainder of 2022, but risks to the farm economy have become more notable.
“Crop and livestock prices remained elevated, but have been volatile in recent months alongside ongoing uncertainty about the outlook for supply and demand of some major commodities. With substantial increases in production costs over the past two years, profit margins for many producers could be pressured with a sizable decline in commodity prices. Despite growing risks, balance sheets for most producers remained strong and profit opportunities during 2022 remained well in reach.”
Meanwhile, Bloomberg writer Jen Skerritt reported yesterday that, “A turnaround in Canada’s wheat crop may help boost world supplies.
“Output from the world’s seventh-largest wheat exporter will rise 55% to 34.6 million metric tons this year as yields improve amid better moisture and more moderate temperatures, Statistics Canada said Monday in a report. That makes 2022 the third best harvest in records dating to 1908, falling just short of 2020’s bounty and the record 37.6 million tons gathered in 2013.”

The Bloomberg article explained that, “Global wheat supplies have been uncertain after Russia’s invasion of Ukraine and extreme weather trimmed output in parts of Europe. While shipments are flowing out of Ukraine again, there are fears about the next crop as a chunk of farmland was lost in the war. Drought is also shrinking crops from the US Farm Belt to China.”
And Dow Jones writer Kirk Maltais reported yesterday that, “Another above-average crop production year is expected in Australia, according to Sydney-based IKON Commodities. The firm forecasts that this year will mark a third consecutive bumper crop, thanks to better-than-average weather conditions. The firm forecasts wheat production at 35.8 million metric tons, which is up 40% from the average. Production of barley and canola is also expected to be higher than usual. Across the continent, above-average rainfall was reported – creating better soil moisture and helping crop development. While crop growth in Australia is strong, other areas are experiencing difficulties amid long-term drought conditions – including the U.S., China, and the EU.”
Also yesterday, Reuters writer Emily Chow reported that, “China’s agriculture minister expressed concern for the country’s autumn grain production, according to a ministry statement on Monday, and said high temperatures and drought have hit rice production in the eastern Jiangsu and Anhui provinces.
“China’s agriculture ministry cited Tang Renjian as saying that it is currently ‘the critical period for the autumn grain’s crop yield formation,’ and that ‘the high temperatures and drought had a certain impact on rice production in some areas’ following a visit to several rice fields in the provinces.”
More narrowly regarding EU crop prospects, Reuters writer Sybille de La Hamaide reported today that, “Consultancy Agritel on Tuesday increased slightly its estimate of this year’s French soft wheat crop but warned the European Union’s top grain producer was heading for its worst maize harvest this century.
“In a cereal market update, it put the 2022 soft wheat crop at 33.63 million tonnes, up from 33.44 million projected a month ago but still below the average of the past five years.”
Elsewhere, Reuters writer Naveen Thukral reported today that, “The Russia-focused Sovecon consultancy said on Monday it had raised its forecast for Russia’s wheat exports in the 2022/23 marketing season which started on July 1 by 200,000 tonnes to 43.1 million tonnes.”
With respect to the U.S. crop, the Reuters article noted that, “The U.S. Department of Agriculture (USDA), in a report issued after the close of trading on Monday, rated 54% of the nation’s corn crop in good-excellent condition, down from 55% a week earlier and in line with analysts’ estimates.
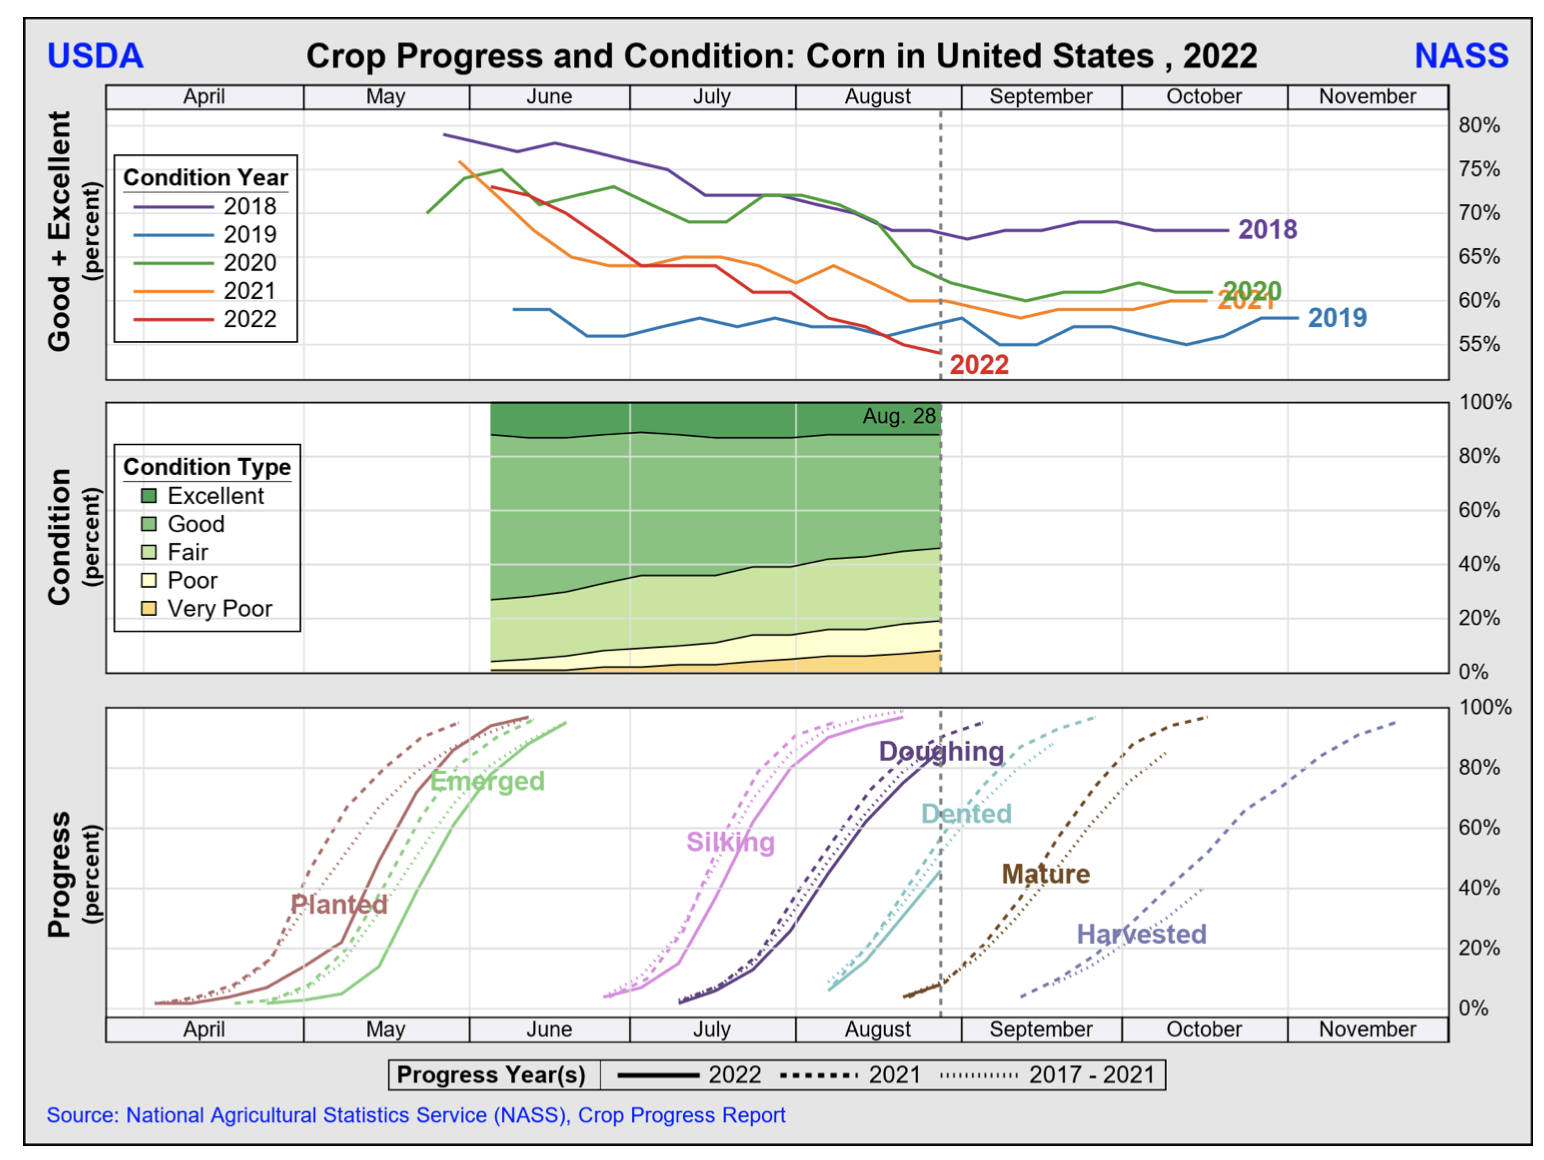

“Ratings for the soybean crop were unchanged at 57% good-excellent, above expectations for 56%.”
The Reuters article added that, “Ukraine’s agricultural exports could rise to 6 million-6.5 million tonnes in October, double the volume seen in July, as its sea ports gradually reopen, the country’s agriculture minister said on Monday.”